Oxbridge-Science-Academy.github.io
Steady State Approximation
Back to Chemical Kinetics Home
Copyright Oxbridge Science Academy 2022
We can extend the idea of sequential reactions and the analysis discussed in the previous section to a very common example - the steady state approximation.
Consider a reaction consisting of two steps:
Where the first step has rate constant and the second step rate constant
.
While this may appear strange, such a situation is common in chemistry. A could represent an unstable species which undergoes a unimolecular reaction to form an intermediate B which then decays into stable product C. We can write differential equations for the three species:
You should ensure you understand how these differential equation have been reached - see Sequential Reactions if you are not sure.
Solving this system is not impossible but if we included further reactions such as reverse reactions ( and
), matters swiftly become very complicated.
However, some simplifications can be made in a particular circumstance, specifically when:
In this case, species B is produced much more slowly than it is destroyed. In other words, as soon as it is produced it reacts further and so its concentration will never build up. Furthermore, the rate of change of B is also negligible as it never exceeds miniscule concentrations. This means we can write:
Equating this to the expression we derived earlier:
Where we have used the subscript “ss” to indicate this the “steady state” concentration of B
Deriving explicit expressions for [A], [B] & [C]is left for the student in the questions.
Using the steady state concentraion of B, we can derive an alternative expression for the rate of production of species C:
Therefore we see that the production of C mirrors the loss of initial reactant A.
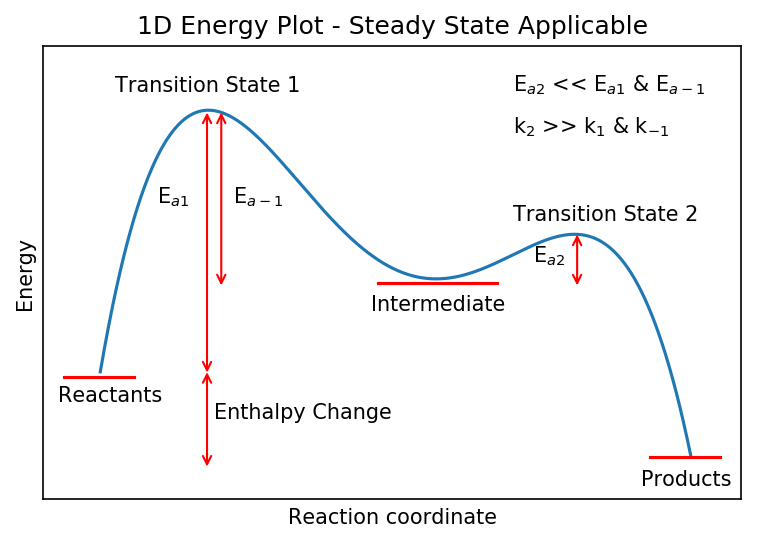
This is known as the Steady State Approximation and is used to simplify the kinetics of complex schemes. It is only valid when the rate of loss of a species (in this case B) is much faster than its production. The energy plot below shows a situation where steady state is applicable. A corresponds to “reactants”, B the “intermediate” and C the “products”. This plot is also more rigorous and includes the reverse reaction with rate coefficient
.

Non-steady state cases
It is also worth considering the situation where steady state is not applicable. Here, these would the cases where:
or
Note that “~” means “comparable to” and in the physical sciences is typically taken to be within a factor of 5 or 10.
In these cases, B is formed at least as quickly as it is destroyed and potentially more quickly. Therefore, [B] will be non-negligible and, more importantly,:
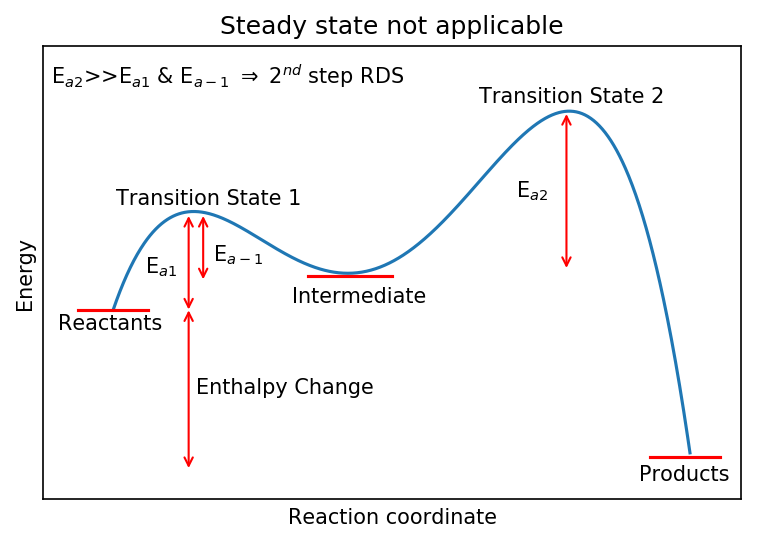
A situation where steady state is not applicable is shown below. The large activation barrier the intermediate must overcome to produce the final product means it will not decay away rapidly.

Validity of Steady State
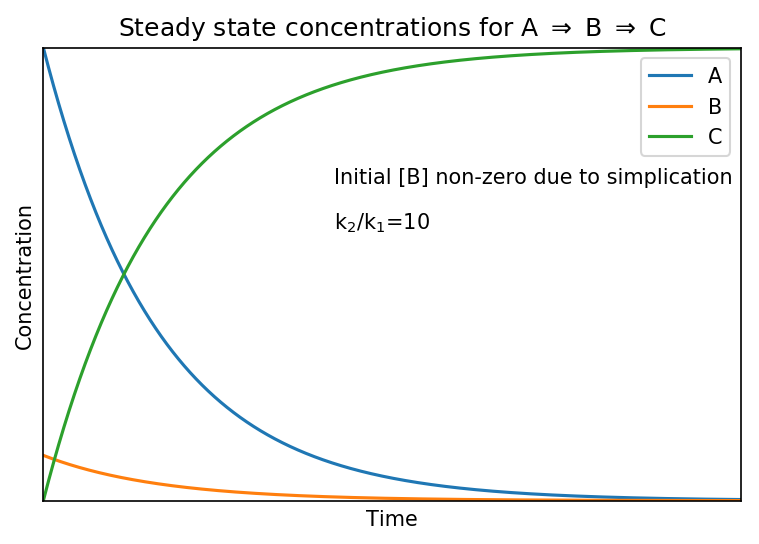
The steady state approximation fails to reproduce the actual concentration of at [B] at the start of the reaction as it predicts a non-zero value whereas in reality it will be zero because A has not reacted yet.
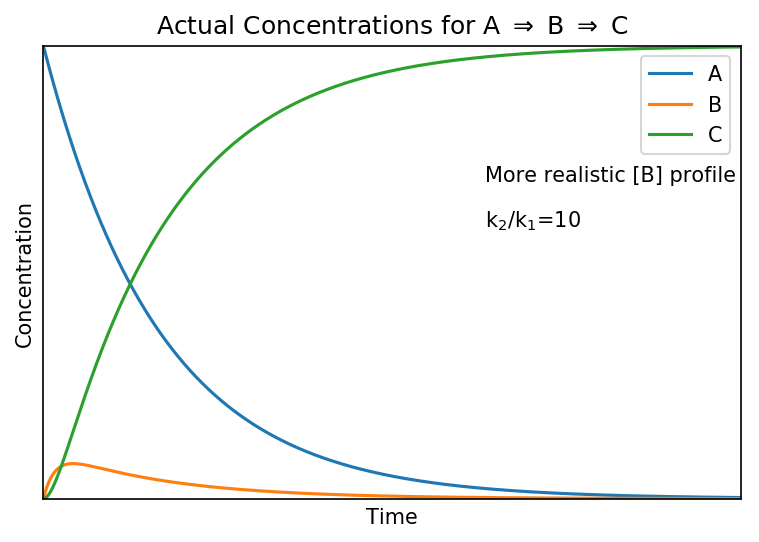
Shown below are the actual (upper) and steady state (lower) concentration profiles for the system when
.
The “actual concentration” profile are calculated by solving the differential equations stated at the top of the page.


We see that the steady state approximation does not affect [A]. The profile of [C] increases slightly more slowly in the “actual” case, reflecting the lag which is caused by the initial formation of [B]. However, for the most part [C] is unchanged.
The profile of [B] shows the biggest difference; it is non-zero in the steady state case but in the more realistic “actual” case it rises briefly as its production dominates before its destruction dominates and it declines. It is a valid point that [B] does change with time in both but the speed of change is small relative to changes in [A] and [C], justifying the approximation that:
We can use graphical means to investigate how the ratio of to
affects the validity of the steady state approximation. Shown below are the concentration profiles of B using the actual and steady calculations. When the ratio is small, the two profiles compare poorly but as it increases, the match becomes much better, indicating that the steady state approximation is more acceptable.
